Introduction
In this work we describe an execution-based model profiling approach by modeling an autonomous-driving vehicle control system in UML, where the main behavior is modeled with statecharts. Code generated from this model provides activity logging information at runtime, which is used to represent the interaction between the components of the system and their behavior. From the outputted logs a sequence diagram (SD) is generated by using a tool called UML Miner. These sequence diagram is then analysed and transformed back to statecharts (SC) by means of metamodeling and model transformation.Approach
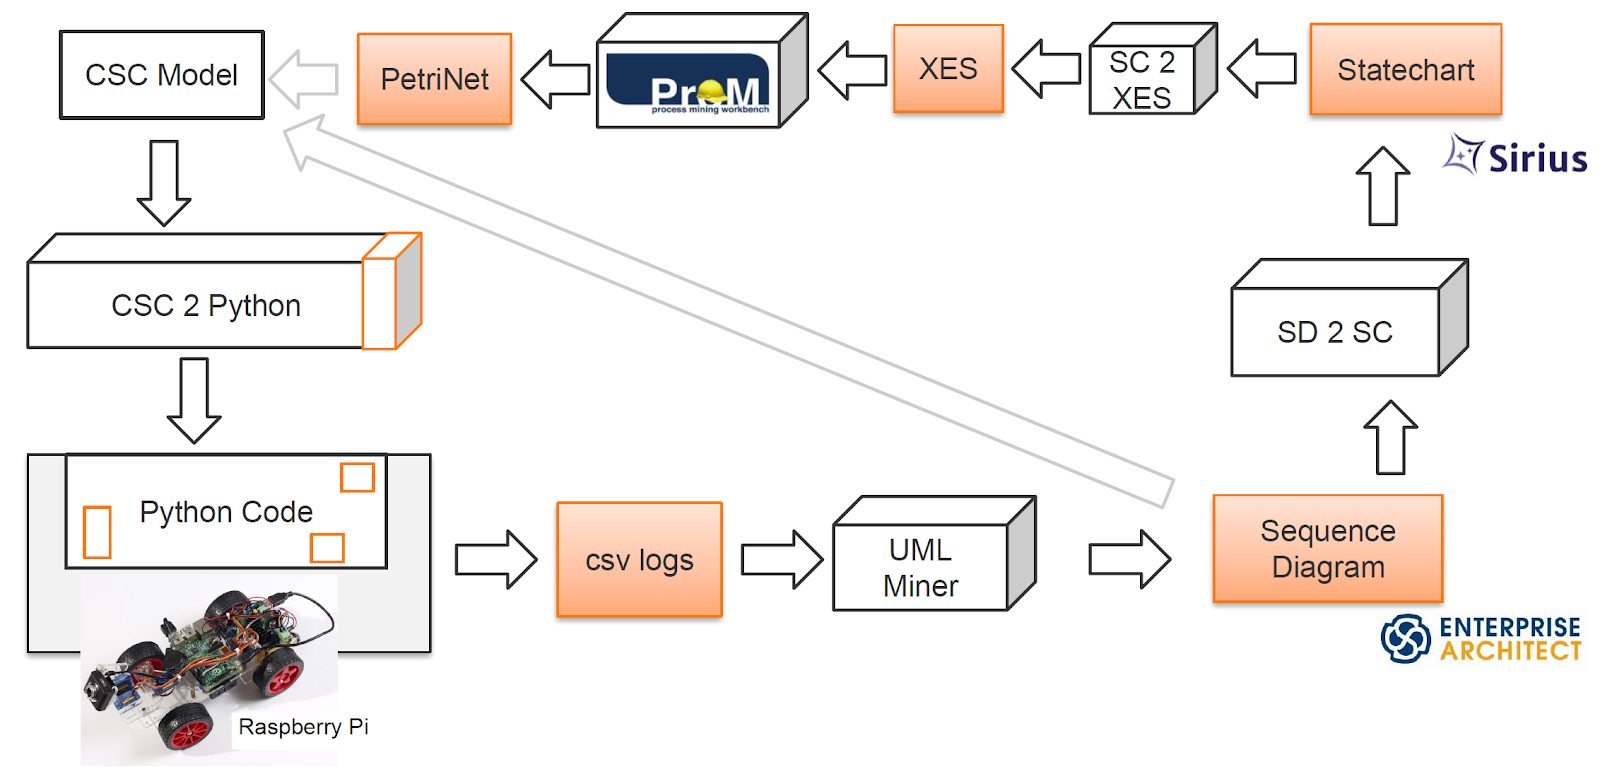
Our approach is based on the unifying conceptual framework for execution-based model profiling. An adapted version of this framework is presented in the figure below.
The framework has two perspectives: the prescriptive perspective on the left-hand side, where design models are used to create a system, and the descriptive perspective on the right-hand side, where observation models are used to describe the actual system behavior at runtime.
In the prescriptive perspective a design model is used to prescribe how a certain system should be built on the modeling level. This design model is created in design language, which resides on the metamodeling level above the design model.
In the descriptive perspective there is an observation language on the metamodeling level. This language refers to the design language in the prescriptive perspective. The observation language captures the operational semantics of the design language, i.e. everything that can change in a running system modeled in this design language.
The observation models conform to the observation language and can be transformed into model profiles for further analysis in diverse tools such as process mining tools, runtime verification tools, monitoring tools.
In our extension of this approach we take sequence diagrams and statecharts as model profiles. We suggest to transform the observation model into a sequence diagram to observe actual interaction of the system components at runtime. The next step is to transform the sequence diagram into one or several statecharts. New statecharts give a different overview of the system and the objects in the system.
Case Study
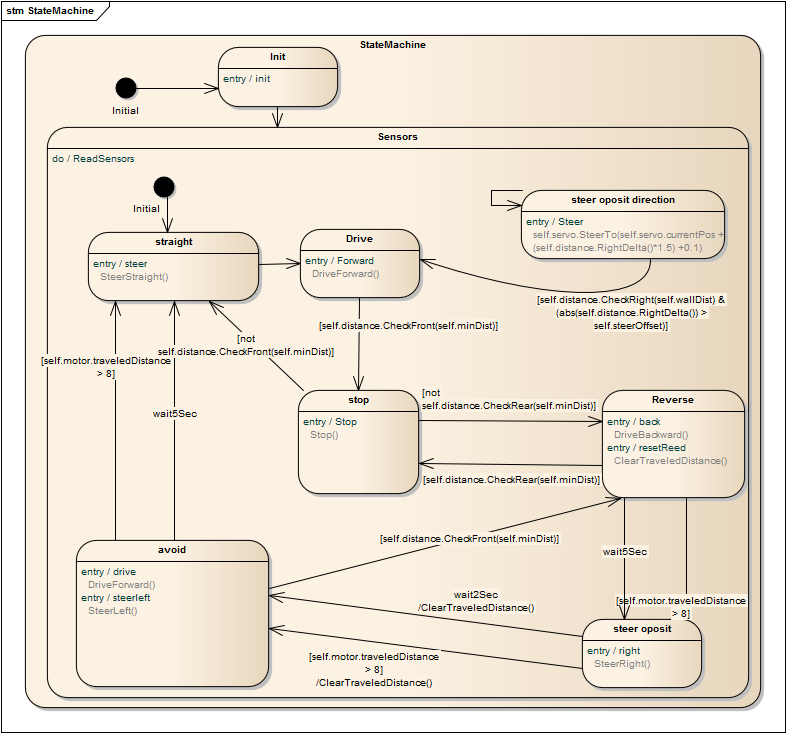
The main goal of case study is to evaluate to what extent descriptive models such as sequence diagrams and statecharts can be applied to analyze and improve a model-driven engineered system. In particular, we analyze a Raspberry Pi-based car, which software is a fully model-driven engineered system. We enhanced this system with execution-based model profiling capabilities, performed live experiments, collected the runtime information in form of observation models and transformed them into SD and SC.The example has been modeled using a small subset of UML, which has been named Class/Statecharts (CSC). The modeled state chart of PiCar is shown below.
Technical Realization
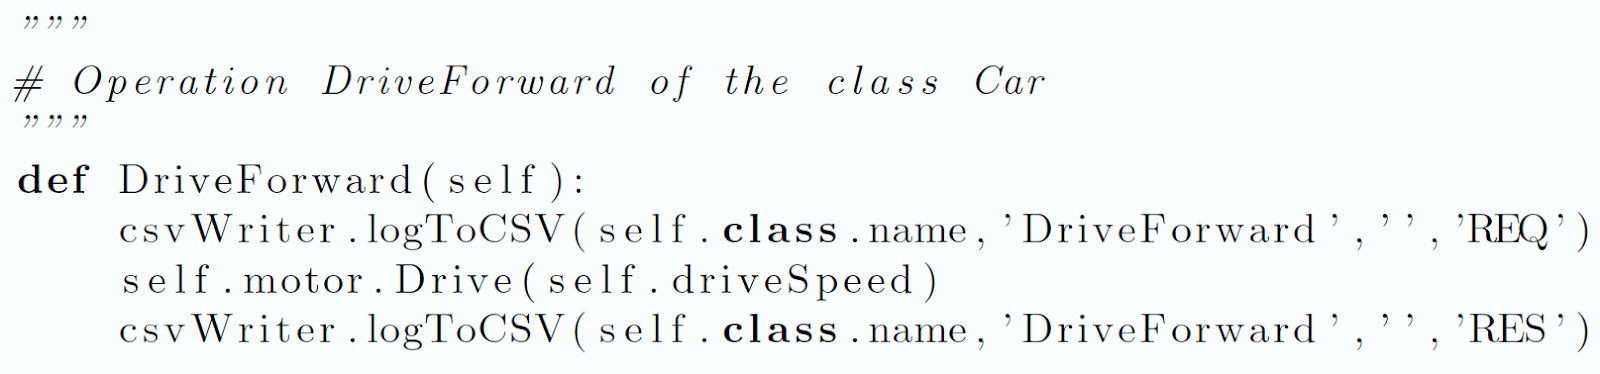
The technical realization of the case study has six major steps:- Logging instrumentation of the system under study (SUS) - we implemented a logging component named csvWriter in Python that is used by the SUS at runtime. This component creates a CSV file and adds rows to this file every time the component is called from an operation.
- Extension of the code generator - we extended the code generator in such a way, that the name of the required log call can be modeled as tagged values of the package on which the code generation is called. Additionally some mapping or specification for the parameters of the log call has to be introduced.
- Transformation of logs into a sequence diagram - we used UML Miner to transform CSV logs into a sequence diagram in XMI format. This XMI file can be imported into Enterprise Architect (http://www.sparxsystems.com/products/ea/), where it is visualized as a sequence diagram. Further we transformed this XMI file into statecharts.
- Metamodel extraction from the generated sequence diagrams - we created a metamodel for files generated by UML Miner. We decided to construct a XML-schema (XSD) of generated files. To generate XSD we used a tool inst2xsd (Instance to Schema Tool) from XMLBeans Tools library. Then we took the created XSD-files as source for the generation of an Ecore model, that we used for further research.
- Transformation of the sequence diagram into a statecharts - we decided to take an approach proposed by Tewfic Ziadi, Loic Helouet and Jean-Marc Jezequel. To realize a sequence diagram into statecharts transformation, we created a target metamodel for state machines in EMF. We used a simplified metamodel of the UML statechart. At this point, generated XMI files from this case study did not contain any additional combined fragments, which are responsible for the composition operators. So the only possible way, we could get basic flat statecharts, was to transform lifelines without any additional conditions, into flat statecharts.
- Visualization of the statecharts - we developed a graphical concrete syntax for statecharts with Sirius that allows to display statecharts and results of our research in visual and more human form. We used the graphical concrete syntax to test data and to make high-level analyses of the observation model.
Observation language
The metamodel of the observation language is derived from the operational semantics of the design language CSC used in the context of this study. Both observation language and design language CSC as well as their relation is depicted in the Figure below. The changes at runtime included updates of the attribute values in the static aspect of the system, i.e. class diagram, and changes of the current state and the current fired transition in the dynamic aspect of the system, i.e. statechart. These elements are tagged with the <<observe>> stereotype.
Generated Model Profiles
We derived two types of model profiles from the logs in form of observation models: sequence diagrams and statecharts. We used UML Miner to generate a sequence diagram and the approach described in above to realize the model transformation from sequence diagrams to statecharts.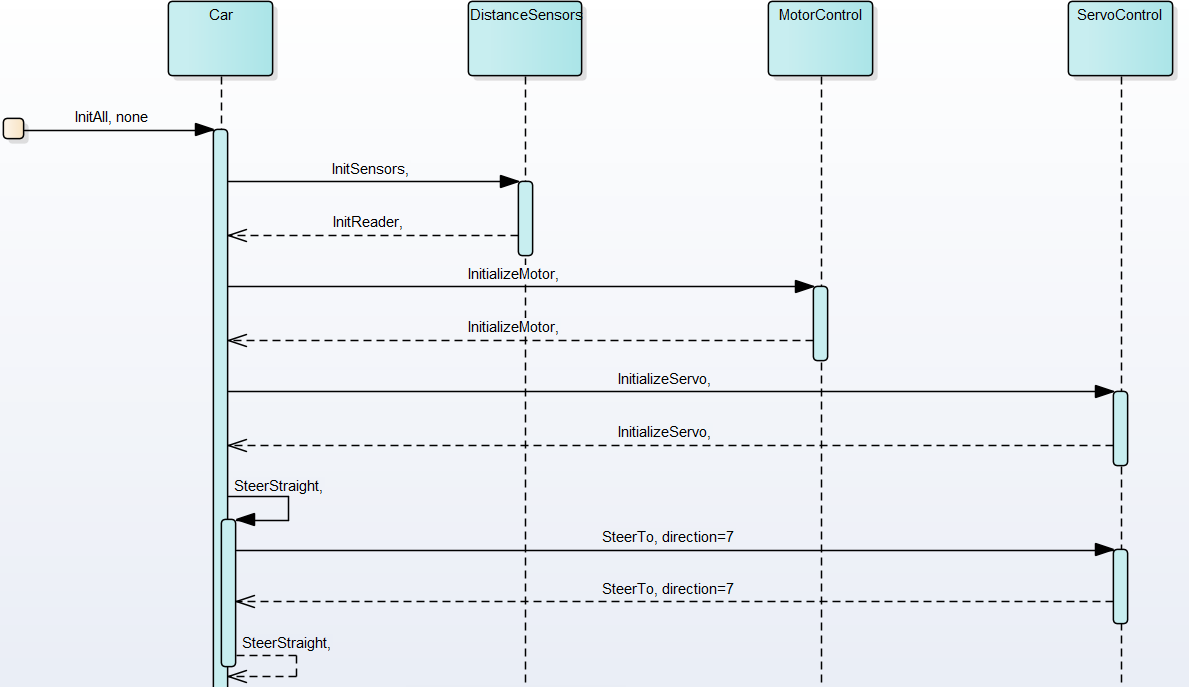

Conclusion and Future Work
In this work, we transformed an observation model into a sequence diagram and further into statecharts to observe the actual interaction of the system components at runtime and gained new information about the system.We extended the unifying framework for execution-based model profiling with operation calls. We took a Raspberry Pi-car as a basis for our case study and fulfilled all the requirements for the system under study. We enhanced this system with execution-based model profiling capabilities and realized the prescriptive perspective of the unifying conceptual framework. During the implementation of this case study we extended the used code generator with the possibility of generating log calls in the code. This logging code reflects the operational semantics of the design language. We performed live experiments and collected runtime information in form of observation models. The descriptive perspective was realized by the implementation of transformation of logs into a sequence diagram and transformation of this sequence diagram into statecharts. After the transformation of logs into the sequence diagram we could observe the internal behavior and communication between the systems objects. These results could be used for the high-level analysis, conformance checking and pattern identification.
While the first results seem promising, there are still several open challenges, which were covered in this work. The quality of the information in the generated sequence diagram could be improved with design pattern recognition. After this improvement we hope to fully realize the chosen algorithm for transforming sequence diagrams into statecharts and to get more information for the high-level analysis of the system behavior.
No comments:
Post a Comment